On the PDBFlex database you will be able to browse through a large number of flexibility
clusters with many viewers and tools.
The paper and this help provides you with all additional information about the tools.
However, we provide specific, quick help references on the top right of each
visualization box, available by clicking on the symbol.
- PDBFlex: exploring flexibility in protein structures. Thomas Hrabe, Zhanwen Li, Mayya Sedova, Piotr Rotkiewicz, Lukasz Jaroszewski, Adam Godzik. Nucleic Acids Res. 2016 Jan 4;44(D1):D423-8. doi: 10.1093/nar/gkv1316
- Between order and disorder in protein structures: analysis of “dual personality” fragments in proteins. Ying Zhang, Boguslaw Stec, Adam Godzik. Structure, 2007, 15 (9), 1141-1147
-
Difference contact maps: from what to why in the analysis of the conformational
flexibility of proteins. Mallika Iyer, Zhanwen Li, Lukasz Jaroszewski, Adam
Godzik.(Submitted, March 2019; In review.)
Download the PLOS Computational Bilogy Draft.
Download the
Supplemental Data.
PDBFlex has three different oportinities for you to browse through the
data.
- Specify the PDB and Chain directly in the search window. For instance,
if you want to browse for 1a50 chain A, you would type
1a50Aand hit enter. You can load a example PDB by clicking on the 1a50A link on the start page. - You can input a protein sequence into the search window and your sequence will be blasted against all known PDB chain sequences. A popup menu will display all hits ordered by sequence similiarity. You can load a example sequence by clicking on the Fasta sequence link on the start page.
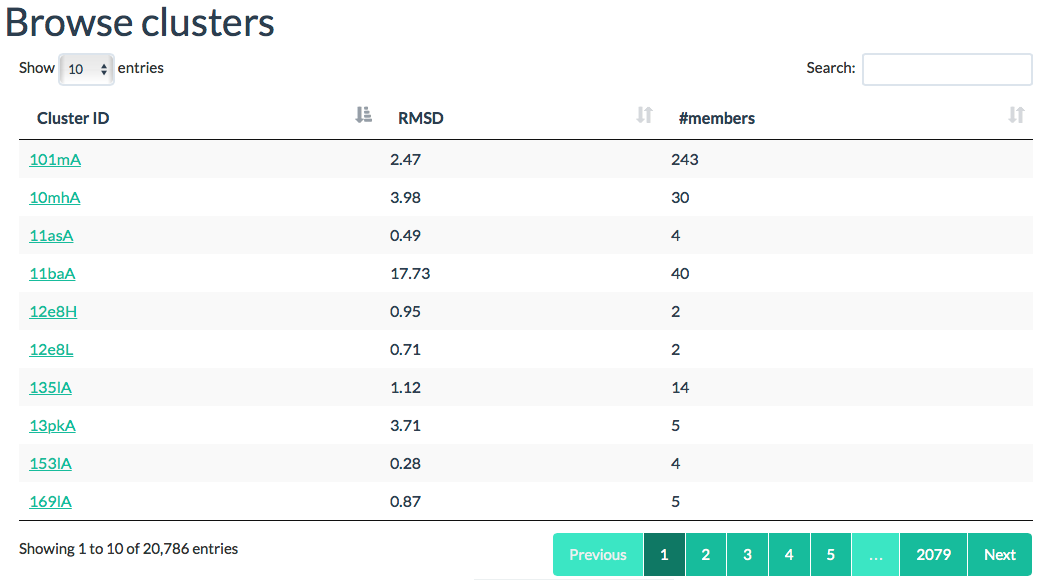
- The final option is to browse through a list of all available clusters in the database. Select the Clusters menu in the top list for this. Here, you can sort all clusters by their size or maximum RMSD
Explanation about some input and output format.
- RMSD Matrix output: the text file includes the RMSD value and
the percentage of residues with consistent contact map overlap for
all-by-all structure pairs in the cluster. The first 2 columns are the
PDB and chain IDs for the structure pair, the 3rd column is the
percentage of contact map overlap, the 4th column is the RMSD
value.
  4ht3A 6c73A   0.959   0.606
  4hpjA 6c73A   0.947   0.637
  4hn4A 6c73A   0.951   0.649
- Superimposed structures for downloading: the tar.gz file includes structures in PDB format for all of its cluster members. All of cluster members are superimposed on the cluster master structure.
Menu
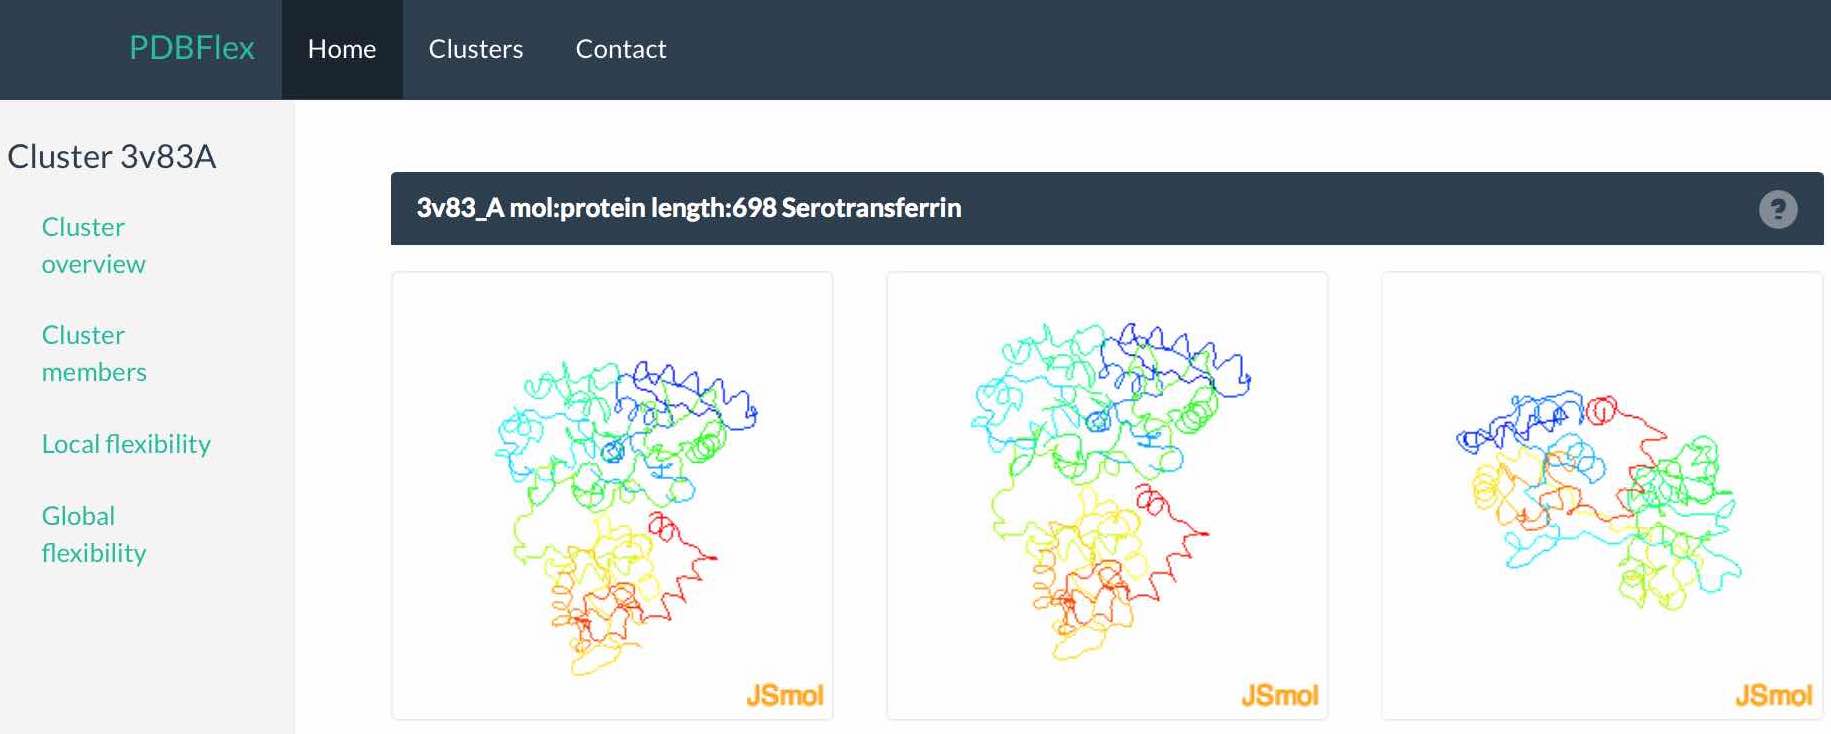
The menu on the left allows you to directly navigate to multiple cluster pages to analyze the current cluster in more detail.
Page
The first look at the main view page will immediately be drawn to the structure animation in the center of the page. Here, two structures within the cluster with the highest Cα RMSD and a morph between these two structures is shown and visualize the maximal flexibility in this respective cluster.
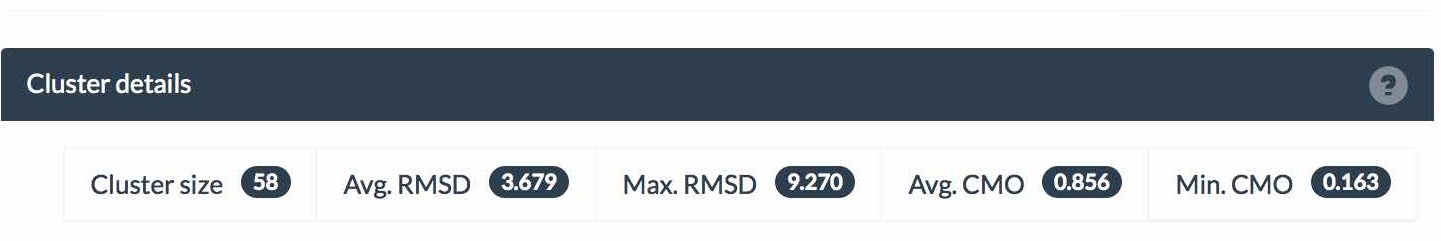
Shown below is the cluster size, average and maximum local RMSD of each structure and the average and minimum Contact Map Overlap (CMO) within the cluster. CMO refers to the proportion of inter-residue contacts conserved between a pair of similar structures (CMO=1 means complete preservation of contacts and CMO=0 means all contacts are different).The equivalence of contacts in two structures is derived from the alignment of their sequences. Average and maximum values of pairwise CMO are shown for each cluster. In general, high RSMD values indicate high global structural flexibility (hinge movements) while low CMO values indicate high local flexibility (changes in secondary structure). In most cases both types of flexibility are present. Read more here.
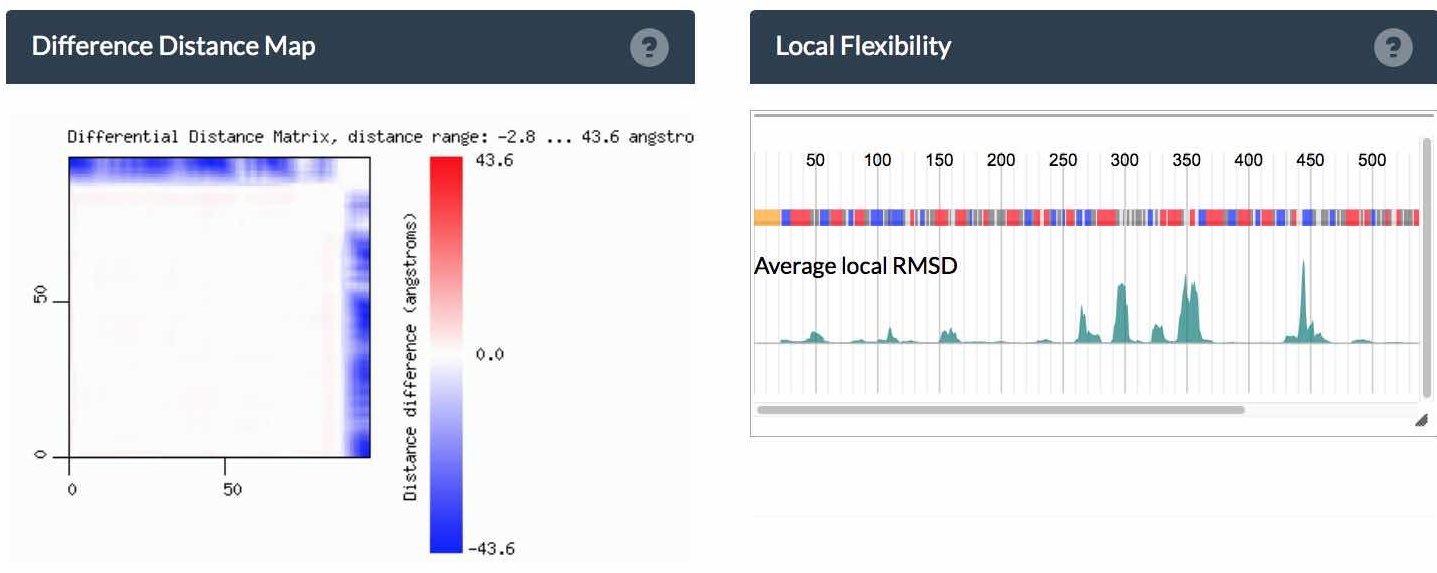
The Difference Distance Matrix (DDM) corresponding to these two structures displayed above displays structural flexibility in the cluster.
The menu on the left allows you to directly navigate to multiple cluster pages to analyze the current cluster in more detail.
Page
The first look at the main view page will immediately be drawn to the structure animation in the center of the page. Here, two structures within the cluster with the highest Cα RMSD and a morph between these two structures is shown and visualize the maximal flexibility in this respective cluster.
Shown below is the cluster size, average and maximum local RMSD of each structure and the average and minimum Contact Map Overlap (CMO) within the cluster. CMO refers to the proportion of inter-residue contacts conserved between a pair of similar structures (CMO=1 means complete preservation of contacts and CMO=0 means all contacts are different).The equivalence of contacts in two structures is derived from the alignment of their sequences. Average and maximum values of pairwise CMO are shown for each cluster. In general, high RSMD values indicate high global structural flexibility (hinge movements) while low CMO values indicate high local flexibility (changes in secondary structure). In most cases both types of flexibility are present. Read more here.
The Difference Distance Matrix (DDM) corresponding to these two structures displayed above displays structural flexibility in the cluster.
Plot
The first row in the plot codes the secondary structure of the master sequence. Secondary structure colorcoding is available on the bottom of the page. The green surface plot below indicates the average, local RMSD variations of all cluster members to the master sequence. Below are all secondary structure assignments for all members.
Menu
The menu on top allows you to zoom a region of the plot to a resultution where residue names become visible. You can also select your favorite secondary structure color-table.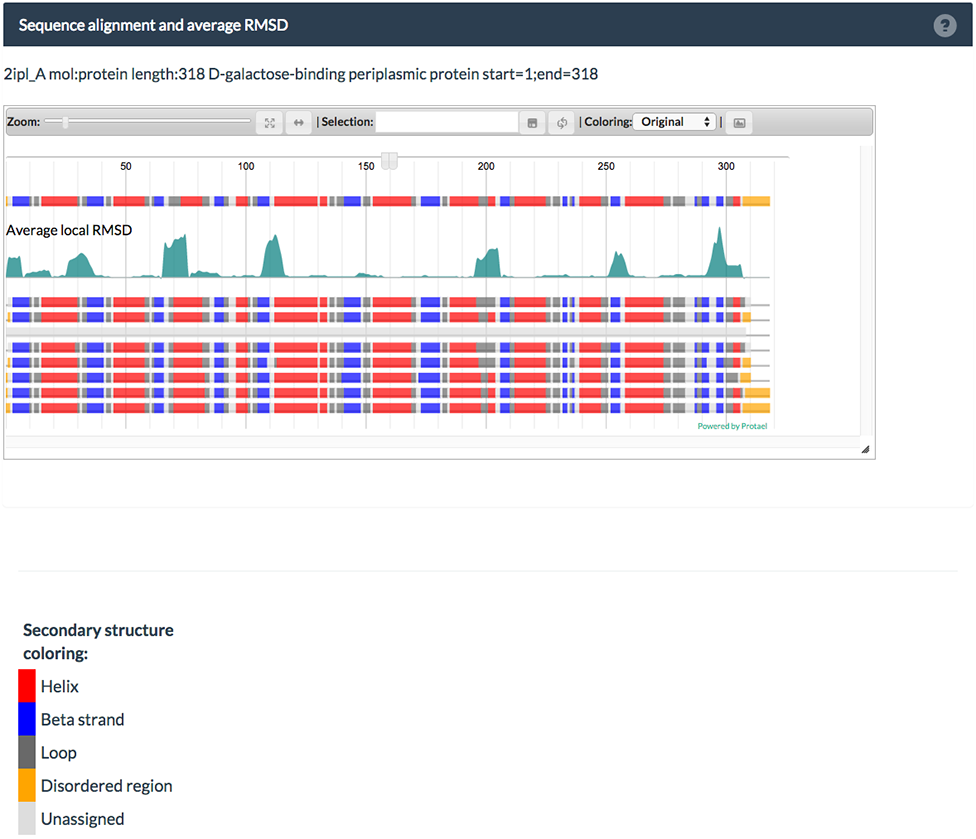
Plot
The plot displays structural flexibility by clustering structures that aggregate due to their cluster similarity. Large, colored points highlight detected centers of sub-clusters and their respective structures are displayed below the plot. Moving your mouse-pointer over either one of the points in the plot will display their PDB and chain ID and all ligands contained in the PDB. Menu
You will see four new View options below the new menu entires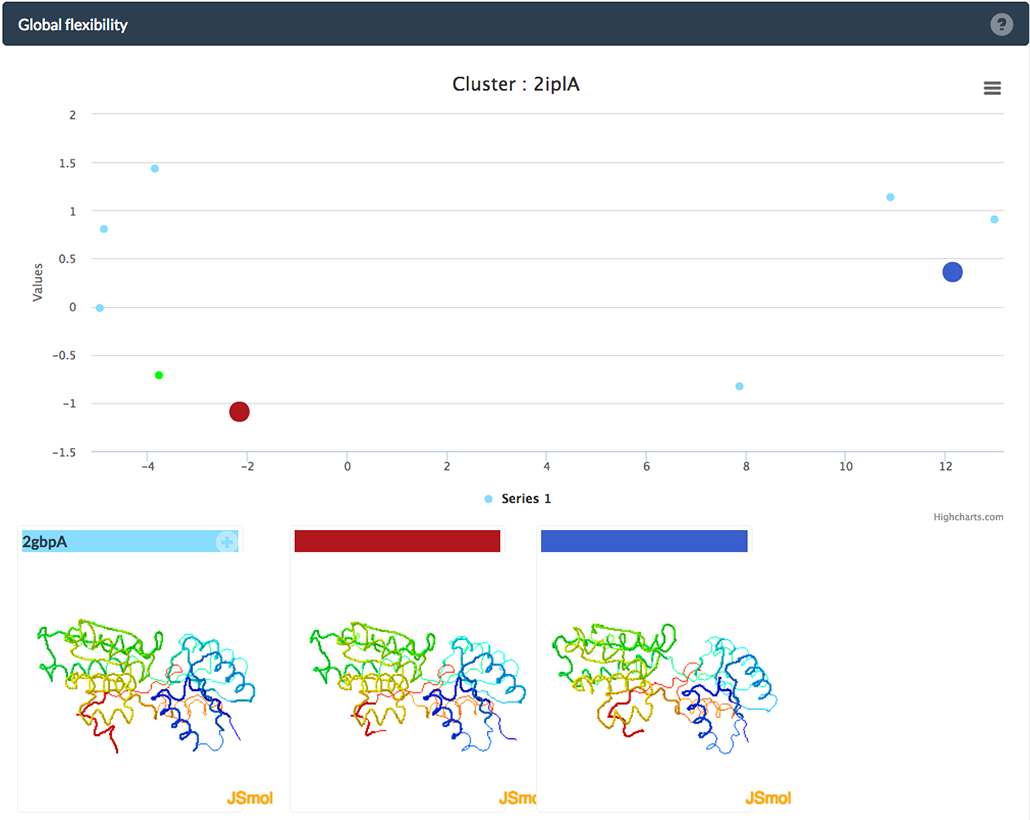
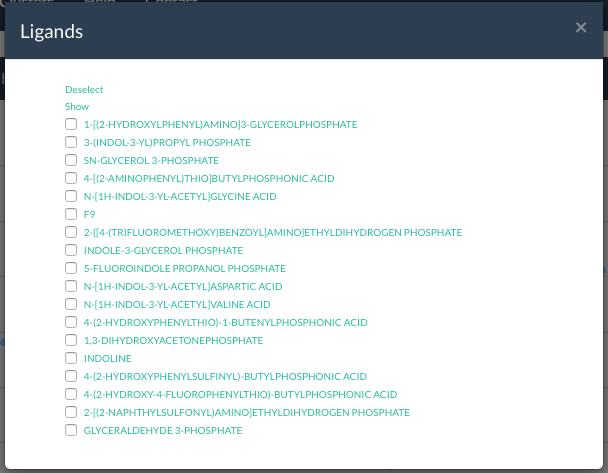
Example list of all ligands for a class. You can select each ligand
The plot displays structural flexibility by clustering structures that aggregate due to their cluster similarity. Large, colored points highlight detected centers of sub-clusters and their respective structures are displayed below the plot. Moving your mouse-pointer over either one of the points in the plot will display their PDB and chain ID and all ligands contained in the PDB. Menu
You will see four new View options below the new menu entires
- Highlight PDB If you are searching for a particlar PDB, simply type the PDB id into this box and the respective point in the plot will start blinking
- Selected Structures When you click on either point to show their structure, you will see a small icon on the top-right corner above the shown structure. Click on the structure and add this PDB to your selection. Selecting Selected Structures will display all selected structures and allow you to analyze them in seperate views, either displayed next to each other, or superimposed. Remove selected structures from the list by clicking on the symbol in the list.
- Ligands Show all ligands found for all PDBs in this cluster. Select one (or multiple) ligands and highlight the respective structures in the plot
- Synchronize Activate this option and structure movement will be synced between all structures.
Example list of all ligands for a class. You can select each ligand
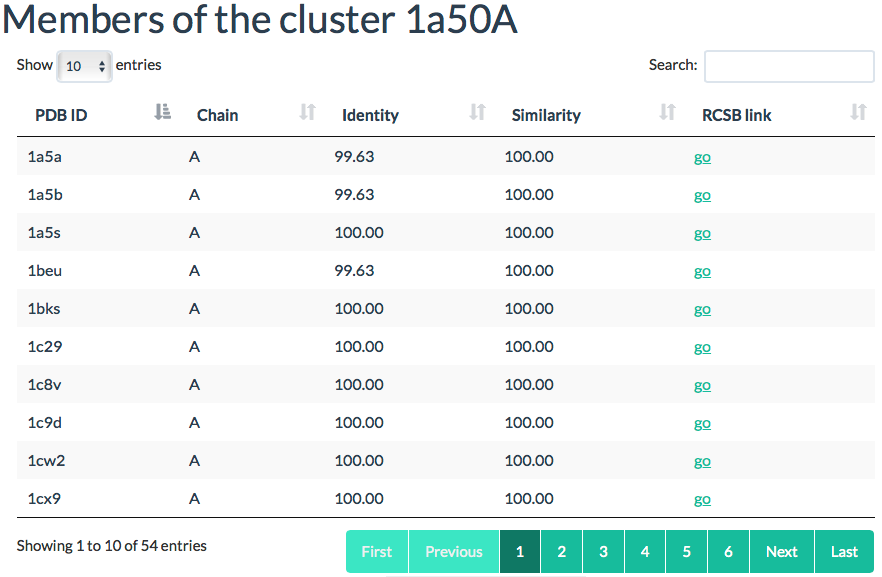
Cluster members
A list of all pdb chains in the cluster. You can sort all chains either by
sequence identity and sequence similarity.
Clusters
All cluster names are listed in this view. You can browse and sort all entries
regarding the cluster size and RMSD within the cluster.